It Started With a Screenshot
Notes from the beginning of an initiative in open geophysics
The origin of QGeophysics was not an accident, nor was it the result of a well thoughout plan or roadmap. It started with a screenshot. Or more accurately, with the suggestion that one should be obtained elsewhere.
The meeting that almost wasn't interesting
I work as a project scientist in the Extended Continental Shelf Studies (CLCS) division at the National Centre for Polar and Ocean Research (NCPOR). The work sits at an unusual intersection of disciplines. On one side are legal boundaries, maritime limits, formula lines and maps. On the other are seismic interpretations, sediment thickness estimates, crustal structure and the geological arguments that ultimately justify those boundaries.
The surface world and the subsurface world meet here every day, usually without incident. GIS specialist works in one environment, seismic interpreter in another, potential field modeller in another still, and everyone quietly assumes someone else will handle the translation between them. Most of the time this arrangement simply feels normal — the way a slightly wobbly office chair feels normal until the day it finally gives out.
Until occasionally it doesn't.
A question about screenshots:
A couple of years ago, during a discussion on modifications to India's continental shelf submissions, the conversation drifted briefly from science to presentation quality. Seismic sections had been interpreted, figures prepared, reports assembled. Somewhere between the coffee going cold and the meeting winding down, attention turned to the quality of the images of the seismic sections coming out of the software available to us.
Near the end of the meeting, our Group Director made an entirely reasonable suggestion: "the next time someone visits ONGC, it might be worth bringing back a few screenshots from their systems, for use in future reports and presentations."
simple practical advice. But it was also the kind of sentence that lodges itself somewhere and refuses to leave, personally speaking.
Not because there was anything wrong with the advice. But because a small, stubborn question started forming somewhere behind it:
"why should producing a publication-quality seismic figure require a trip to somebody else's building, on somebody else's workstation, hoping the screen resolution cooperated?"
Small ambitions
That question eventually became SeisPlotPy.
The original objective was almost embarrassingly modest. Load seismic data. Render it properly. Export a figure that didn't look like it had been smuggled out on a phone camera. Nothing more. The first versions were standalone tools built around Python's plotting ecosystem, no interpretation inside GIS environments, no horizon picking, no grand integrated workflow. Just the plain, unglamorous business of owning your own output.
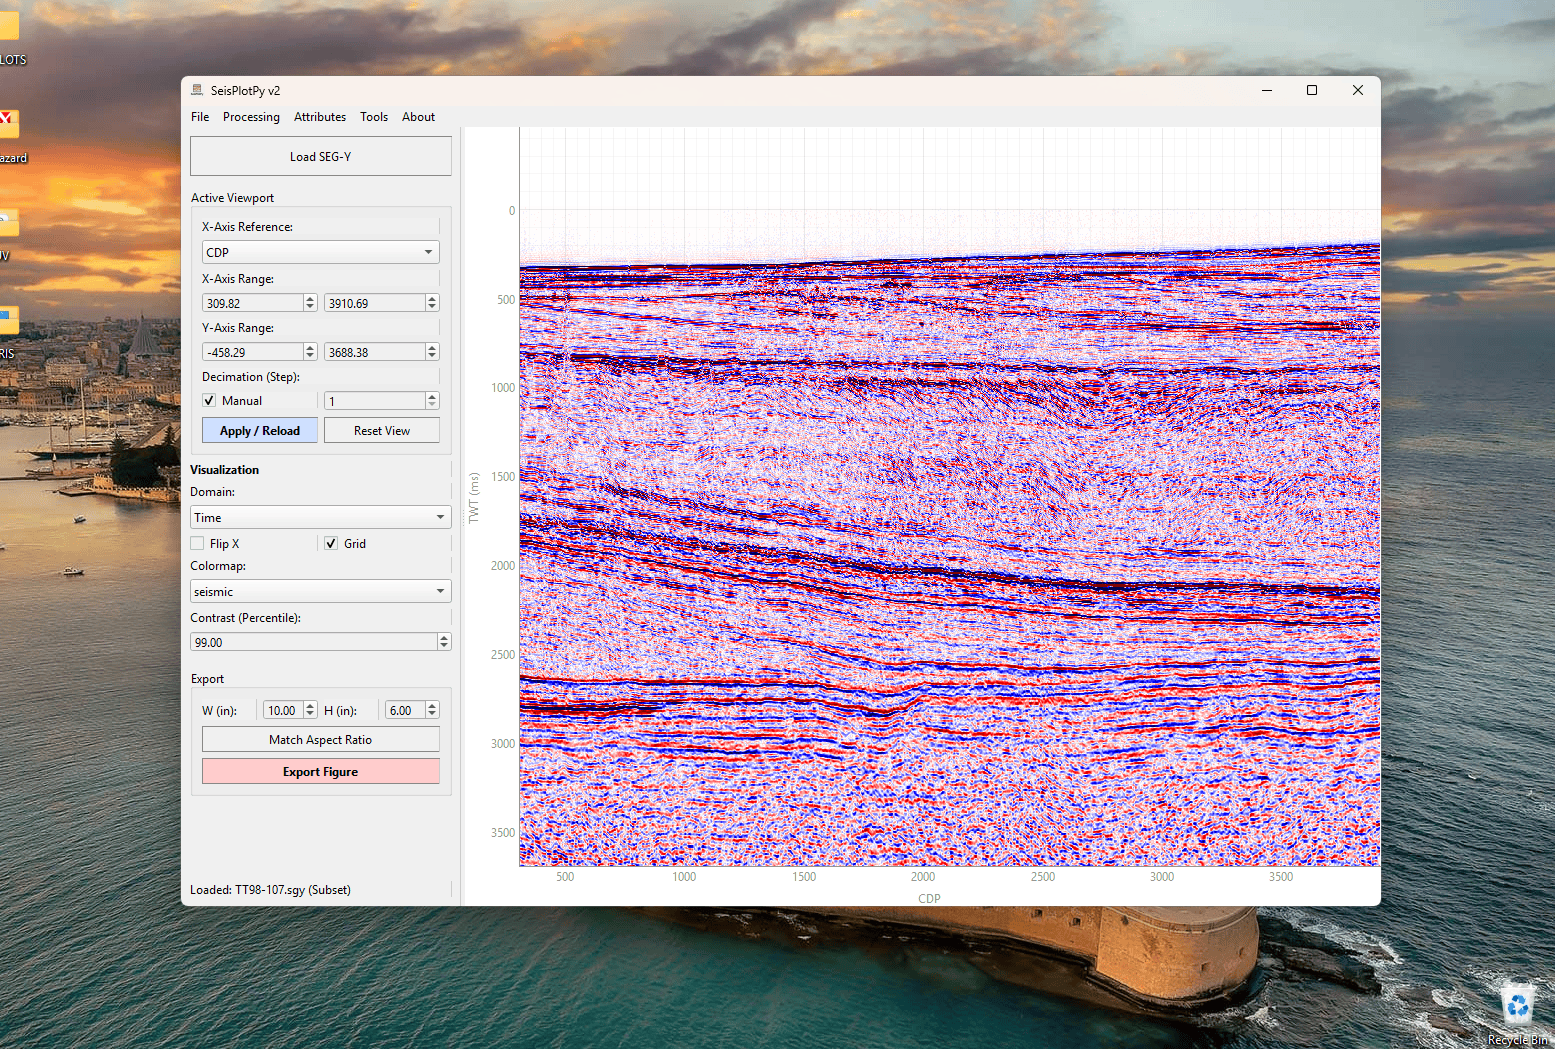
Scientific figures should not feel like screenshots captured from behind the glass of proprietary software. They should be reproducible, publication-quality products of the scientific workflow itself, vector graphics, high-resolution exports, and enough control over the plot that you're not silently apologizing for it in the figure caption. These felt less like nice-to-haves and more like something close to professional dignity.
When spreadsheets become geology
Around the same time, another observation had been quietly forming inside me.
On arriving at NCPOR, I'd assumed "the data" would mean seismic sections, gravity grids, geophysical observations etc., the things geophysicists like me are trained to treat reverently. Instead, a surprising amount of the operational workflow of the CLCS division ran on coordinates, sediment thickness values, basement depths and interpreted horizons, quietly living out their days in spreadsheets and GIS layers.
At first this felt backwards. Then it became genuinely fascinating. Because those tables weren't wrong, or lesser, or a lazy shortcut around the "real" science, instead they were simply the data products the GIS workflow actually needed. For the GIS side of the project, those interpretations were the data. For geophysicists like me, they were often just an intermediate stop for observations that lived somewhere else entirely.
The same project, it turned out, contained multiple perfectly valid definitions of the word "data" and the handoff between them ran almost entirely through spreadsheets, CSV files and shapefiles. Bathymetry grids fit naturally into GIS. Coastlines fit naturally. Formula lines and interpreted surfaces fit naturally. But somewhere beneath the seabed, the workflow quietly fell apart. Seismic lived in one software ecosystem, gravity modelling in another, and everything eventually resurfaced in GIS as an exported table, sometimes, a little worse for the journey.
It became hard not to notice that many of the boundaries between disciplines were also, suspiciously, boundaries between software packages. We have become remarkably comfortable moving geology through spreadsheets, a fact that seemed primordial to me who hasn't had a decade to make peace with it.
Borrowing a foundation instead of building one
The obvious response would have been to build a new geospatial platform that integrates geophysics from scratch. Fortunately, part of that problem had already been solved decades ago, by people considerably more patient with coordinate systems than I am. QGIS already understands projections, spatial indexing, vector data, raster data, and map relationships better than any geophysics side-project should ever attempt to reinvent.
The challenge is never building GIS. The challenge is extending GIS downward, into depth, and into geological time.
QGIS is open source. Anyone could inspect the code. Anyone could understand how something worked. Anyone could validate it, improve it, modify it, or drag it somewhere its original developers had never imagined. Transparency, Reproducibility, Verification, Community improvement, The philosophy of the software and the philosophy of science turns out to be cousins.
The move into QGIS:
Eventually SeisPlotPy moved into QGIS. At first the motivation was purely practical. If seismic sections could exist inside the same environment as bathymetry, gravity anomalies and interpreted surfaces, workflows immediately got simpler. Interpretation itself became more spatially aware. Questions that used to require switching applications, exporting a file, and hoping the coordinate system didn't get jumbled during the trip could suddenly be asked in one place.
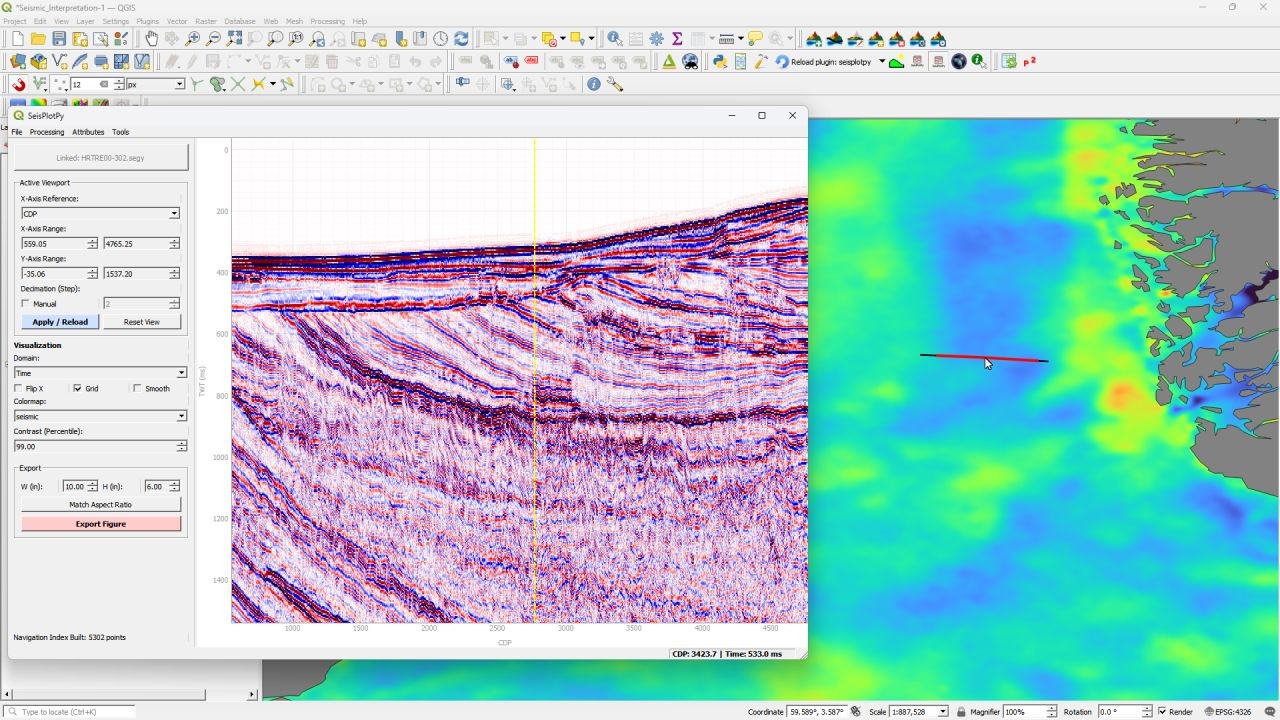
Then the unexpected thing happened.
People started using it. People I had never met, working on data I had never seen, in workflows I had never once considered while writing the code.
Emails from people I'd never met
One person working with sub-bottom profiler data pointed out that the plugin incorrectly assumed projected coordinates for SEG-Y navigation information. Their datasets stored positions in geographic coordinates, using SEG-Y header conventions I hadn't personally encountered before. There is a particular flavor of humility in having someone politely explain, via an email, that a header format you'd never heard of has apparently existed the whole time.
The bug report fixed the software. More usefully, it quietly dismantled an assumption I hadn't known I was carrying.
Other people asked for horizon flattening, wanted multiple SEG-Y files loaded at once, better flexibility with stratigraphic workflows etc. The software gradually became educational for its own author, which incidentally happens to be me. I think that may be one of the best things that can happen to an open-source project: it keeps finding the edges of your imagination and quietly correcting them.
One early response on LinkedIn has stayed with me longer than most. An experienced geoscience professional commented:
"Never thought I would see this. Can wellbore petrophysics be far behind?"
Looking back, it may have been the first QGeophysics question, arriving before QGeophysics had a name to answer to.
The question that wouldn't stay answered
Because once seismic sections existed comfortably inside GIS, the obvious next question refused to leave quietly.
Why stop at seismic?
Why not wells? Why not gravity? Why not magnetics? Why not seismology? Why not electrical and electromagnetic methods?
Why not treat the subsurface as just another dimension of the same spatial problem, instead of a separate country each discipline needs its own passport to enter?
QGeophysics, which is mostly a name right now
That question eventually received a name.
QGeophysics. At the time of writing, it contains almost no code. There is no platform. There is no framework. There is no ecosystem. There is no QGeophysics-core. There is not even a migrated version of SeisPlotPy yet, it continues to live independently, in its own repository, with its own small community of people who have already forgiven it for several early bugs.
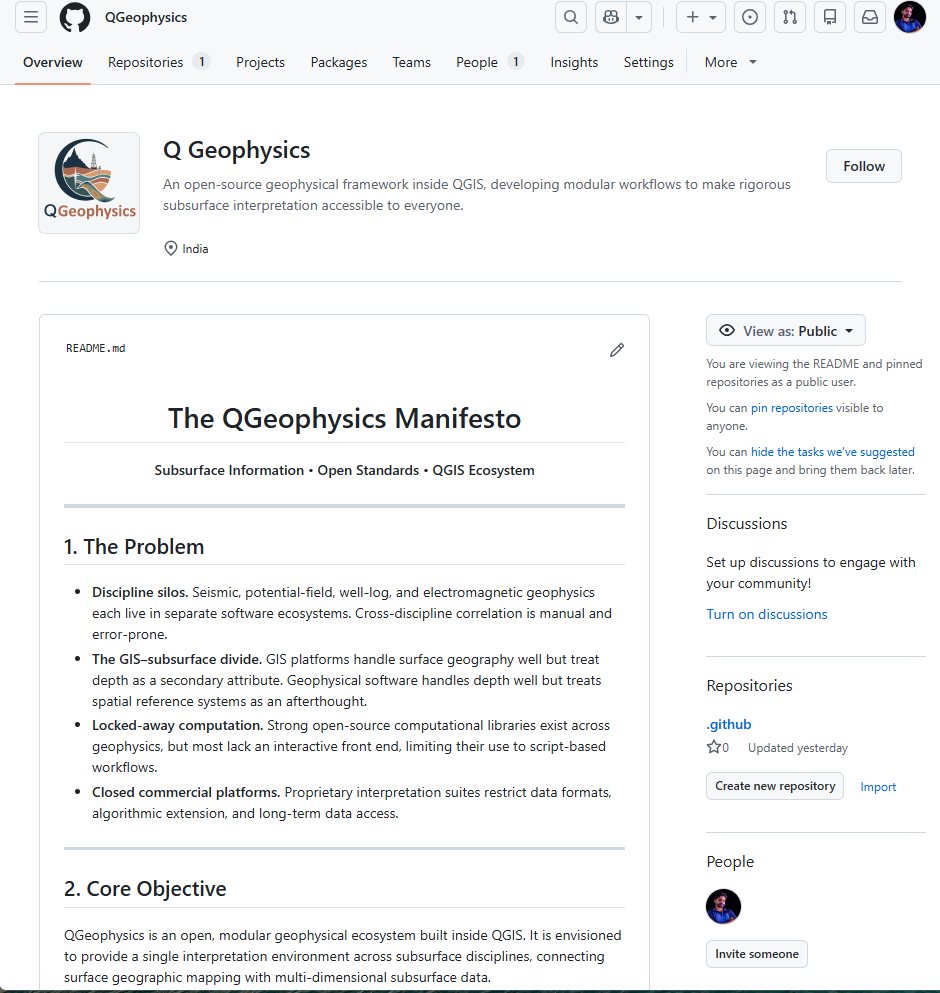
Today, QGeophysics, consists primarily of a GitHub organisation, a manifesto, and a conviction that these boundaries can probably be drawn differently. It is, by any reasonable measure, mostly vibes and a README.
Perhaps that is enough for now.
What this project has already given me
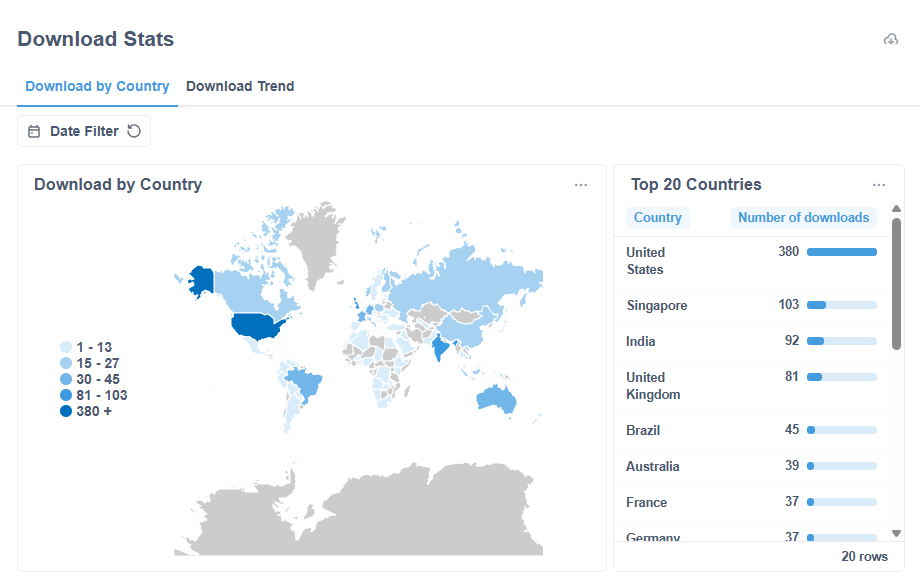
One of the unexpected rewards of building SeisPlotPy has been discovering that problems which felt intensely personal turned out to be surprisingly widespread. The plugin quietly accumulated users in places I never expected it to reach. More valuable than download numbers, though, were the conversations, the assumptions that turned out to be wrong, the workflows that had never been encountered, the questions that had never previously been asked, usually by someone solving a problem I didn't know existed.
I believe that the most useful contribution to an early-stage project is often not code or methodology.
It is perspective.
An open invitation:
So if any part of this resonates, the conversations I would value most are probably not about implementation details.
I would love to hear from geophysicists who have run into the same boundaries between software ecosystems and disciplines, researchers, industry interpreters, students, people working with wells, potential fields, seismology or electromagnetic methods. People willing to point out blind spots, expose assumptions, or simply explain a workflow that lives entirely outside my own experience.
And for anyone building software who finds the kind of uncertainity interesting, the roadmap, such as it is, currently lives in one person's head, and that person also has a day job.
Perhaps nothing comes of it. Perhaps a useful seismic plugin becomes a handful of useful tools. Perhaps something larger eventually emerges. That part is impossible to know from here.
What already feels true to me, however, is that many of the boundaries between our disciplines are software boundaries.
And software boundaries are not geological laws.
Arjun
Please feel free to leave your comments and suggestions...





Leave a Reply
Your email address will not be published. Required fields are marked *

Comments (0)